Category Archives: FAQs

Mont-Blanc shrinks to 4,808.73m

Today’s big news. The height of Mont Blanc is 129 cm lower than in 2013. Read on for the full story:

Mont Blanc was First climbed on August 8 1786. In 1863, the official height was measured as 4807 meters.  At some point after then it became 4809m. That’s the height given by Wikipedia. Now it is recognised as 4810m. The IGN (Institut Géographique National) have it at this height on their maps. You can take a look here.

3595496275_ab709258de_o

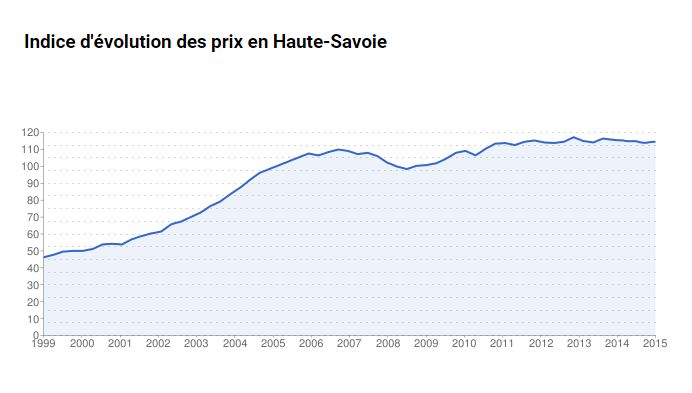
Every two years since since 2001 the height of Mont Blanc has been measured to keep a track of the amount of snow on the summit. The result so far.

2001 : 4 810,40 m
2003 : 4 808,45 m
2005 : 4 808,75 m
2007 : 4 810,90 m
2009 : 4 810,45 m
2011 : 4 810,44 m
2013 : 4 810,02 m
2015 : 4 808,73 m

3596293006_7b49d28584_b

A full report on the current measurement can be found on the Dauphine Libere website. http://www.ledauphine.com/haute-savoie/2015/09/10/l-altitude-du-mont-blanc-mesuree-a-4-808-73-metres. In fact the height of the solid bit (rock not snow) is only 4 792m, the rest is the snow cover, up to 18m of it! The summit moves around depending on the prevailing wind and amount of precipitation.  In 2009 the summit was 34 m further East than now.

September is the time of year when there is least snow on the mountain. This does not tally with the height measured in May (greatest snow depth) of this year at 4807,88m. The discrepancy is probably down to the winds.

3596296618_e6d1b6d044_b (1)

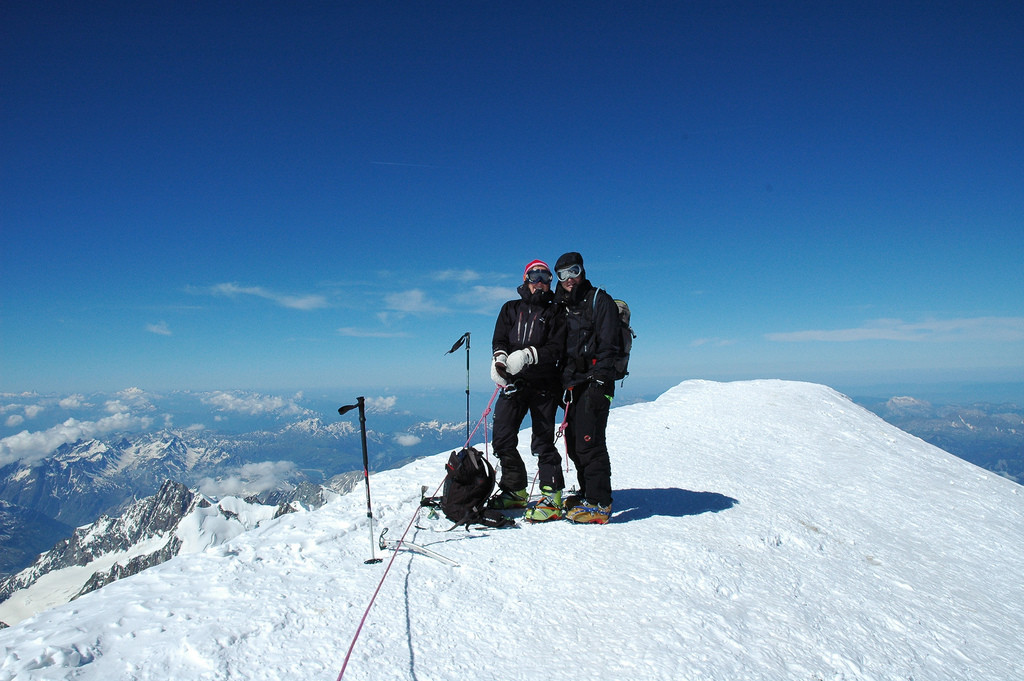
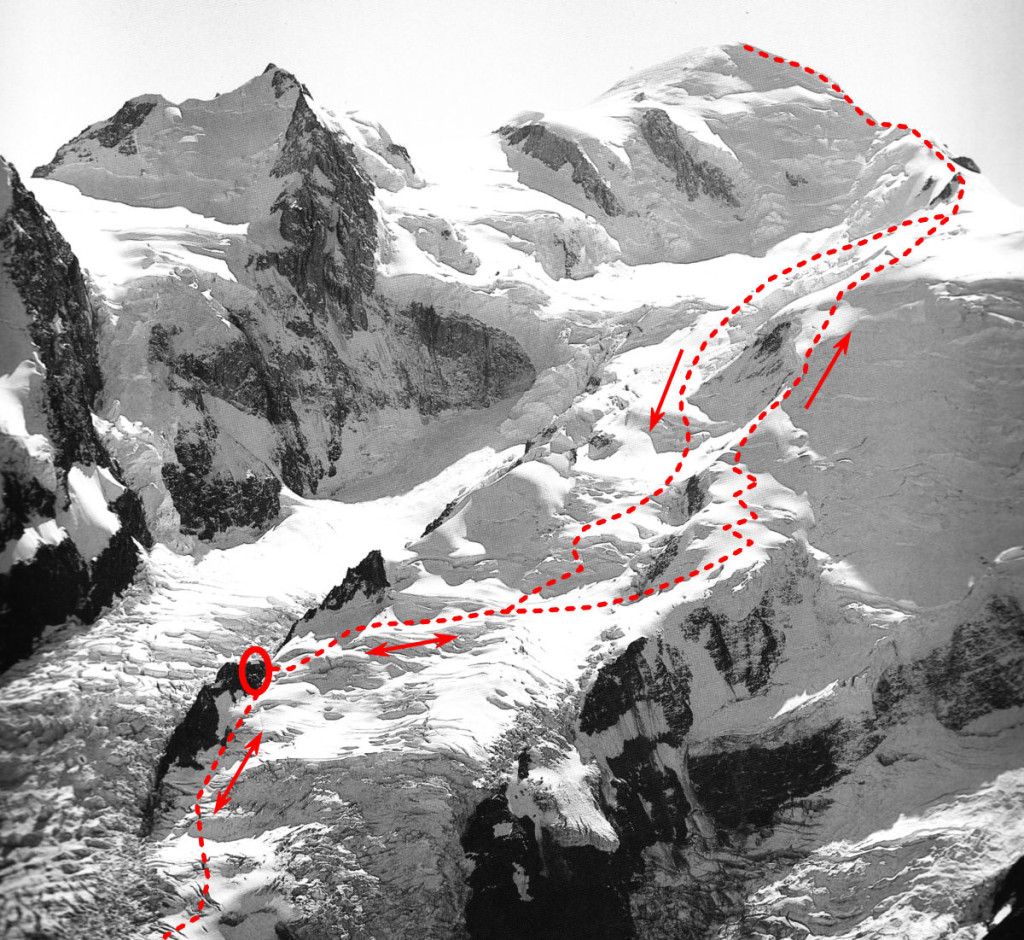
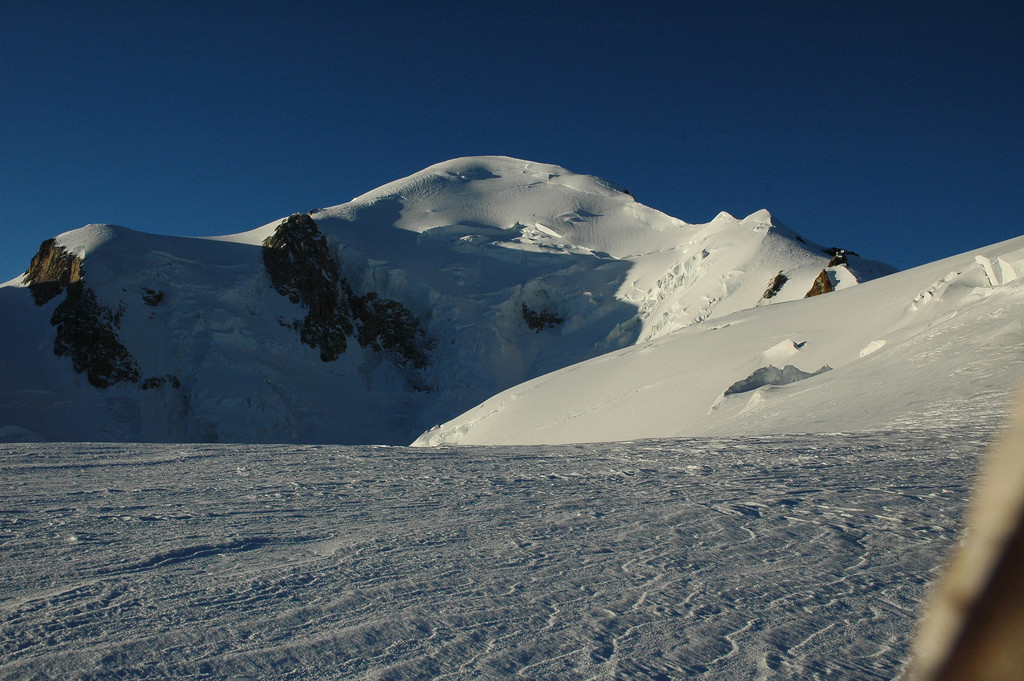
These pictures where all taken on a ski trip to the summit in June 2009. the top one shows the route. The summer walking route takes a different line.


Property Prices across the Haute Savoie

I am often asked about current and historical property pricing data in the Haute Savoie. It is a fair question. In the UK very accurate and open data is available. The answer for France is not quite so straightforward. The Notaires collect all the data, it is publicly available on a broad scale. More accurate information is available on a pay basis, it’s not easy to get though. the free stuff has to be read with caution!

Below is a coloured map of the Haute Savoie, the redder the colour the more expensive the commune. It makes sense, Chamonix, Megeve, La Clusaz, Annecy  and Les Gets come out as the most expensive. Followed by Morzine, Combloux and the rest of the Chamonix valley. Manigod, Le Grand Bornand and  Chatel follow along after that. Samoens should be in that last group too but a quirk of stats has knocked it down a peg.

prix immo

You can click on the image and make it huge or go to the website I took it from.

http://www.meilleursagents.com/prix-immobilier/bonneville-74130/

Take the actual value/m2 with a pinch of salt, this always reads too low in our experience. The price trend graph looks about right though. But read the title, it is for the whole of the Haute Savoie and not for each commune as it seems to suggest on the website! So it shows a massive price increase between 1999 and 2007, a small drop for the following 2 years and then stability. We think this will start to climb again at the end of 2015 and into 2016 driven by the weakened Euro compared to Sterling.

property price evolution

If you zoom out a bit on the commune map you start to see what sort of bubble there is in the ski areas. We already know that you only have to drive 15 minutes from the resort to see the prices half, well looking at this and you’ll see you have to drive an hour from the resort and the prices drop to 25%.

prix immo 2